
 Image 1 of 1
Farm Financial Health Dashboard
Everything your lender wants to see in one workbook.
Enterprise Analysis
Revenue and costs by enterprise (corn, soybeans, cattle, custom work) with overhead allocation by revenue share. Gross margin, net income, and breakeven $/bu by enterprise.
Cash Flow Projection
12-month cash flow with monthly inflows, outflows, and running balance. Identifies operating line needs and peak borrowing months.
Balance Sheet
Current, intermediate, and long-term assets and liabilities. Auto-calculates total assets, total liabilities, and net worth.
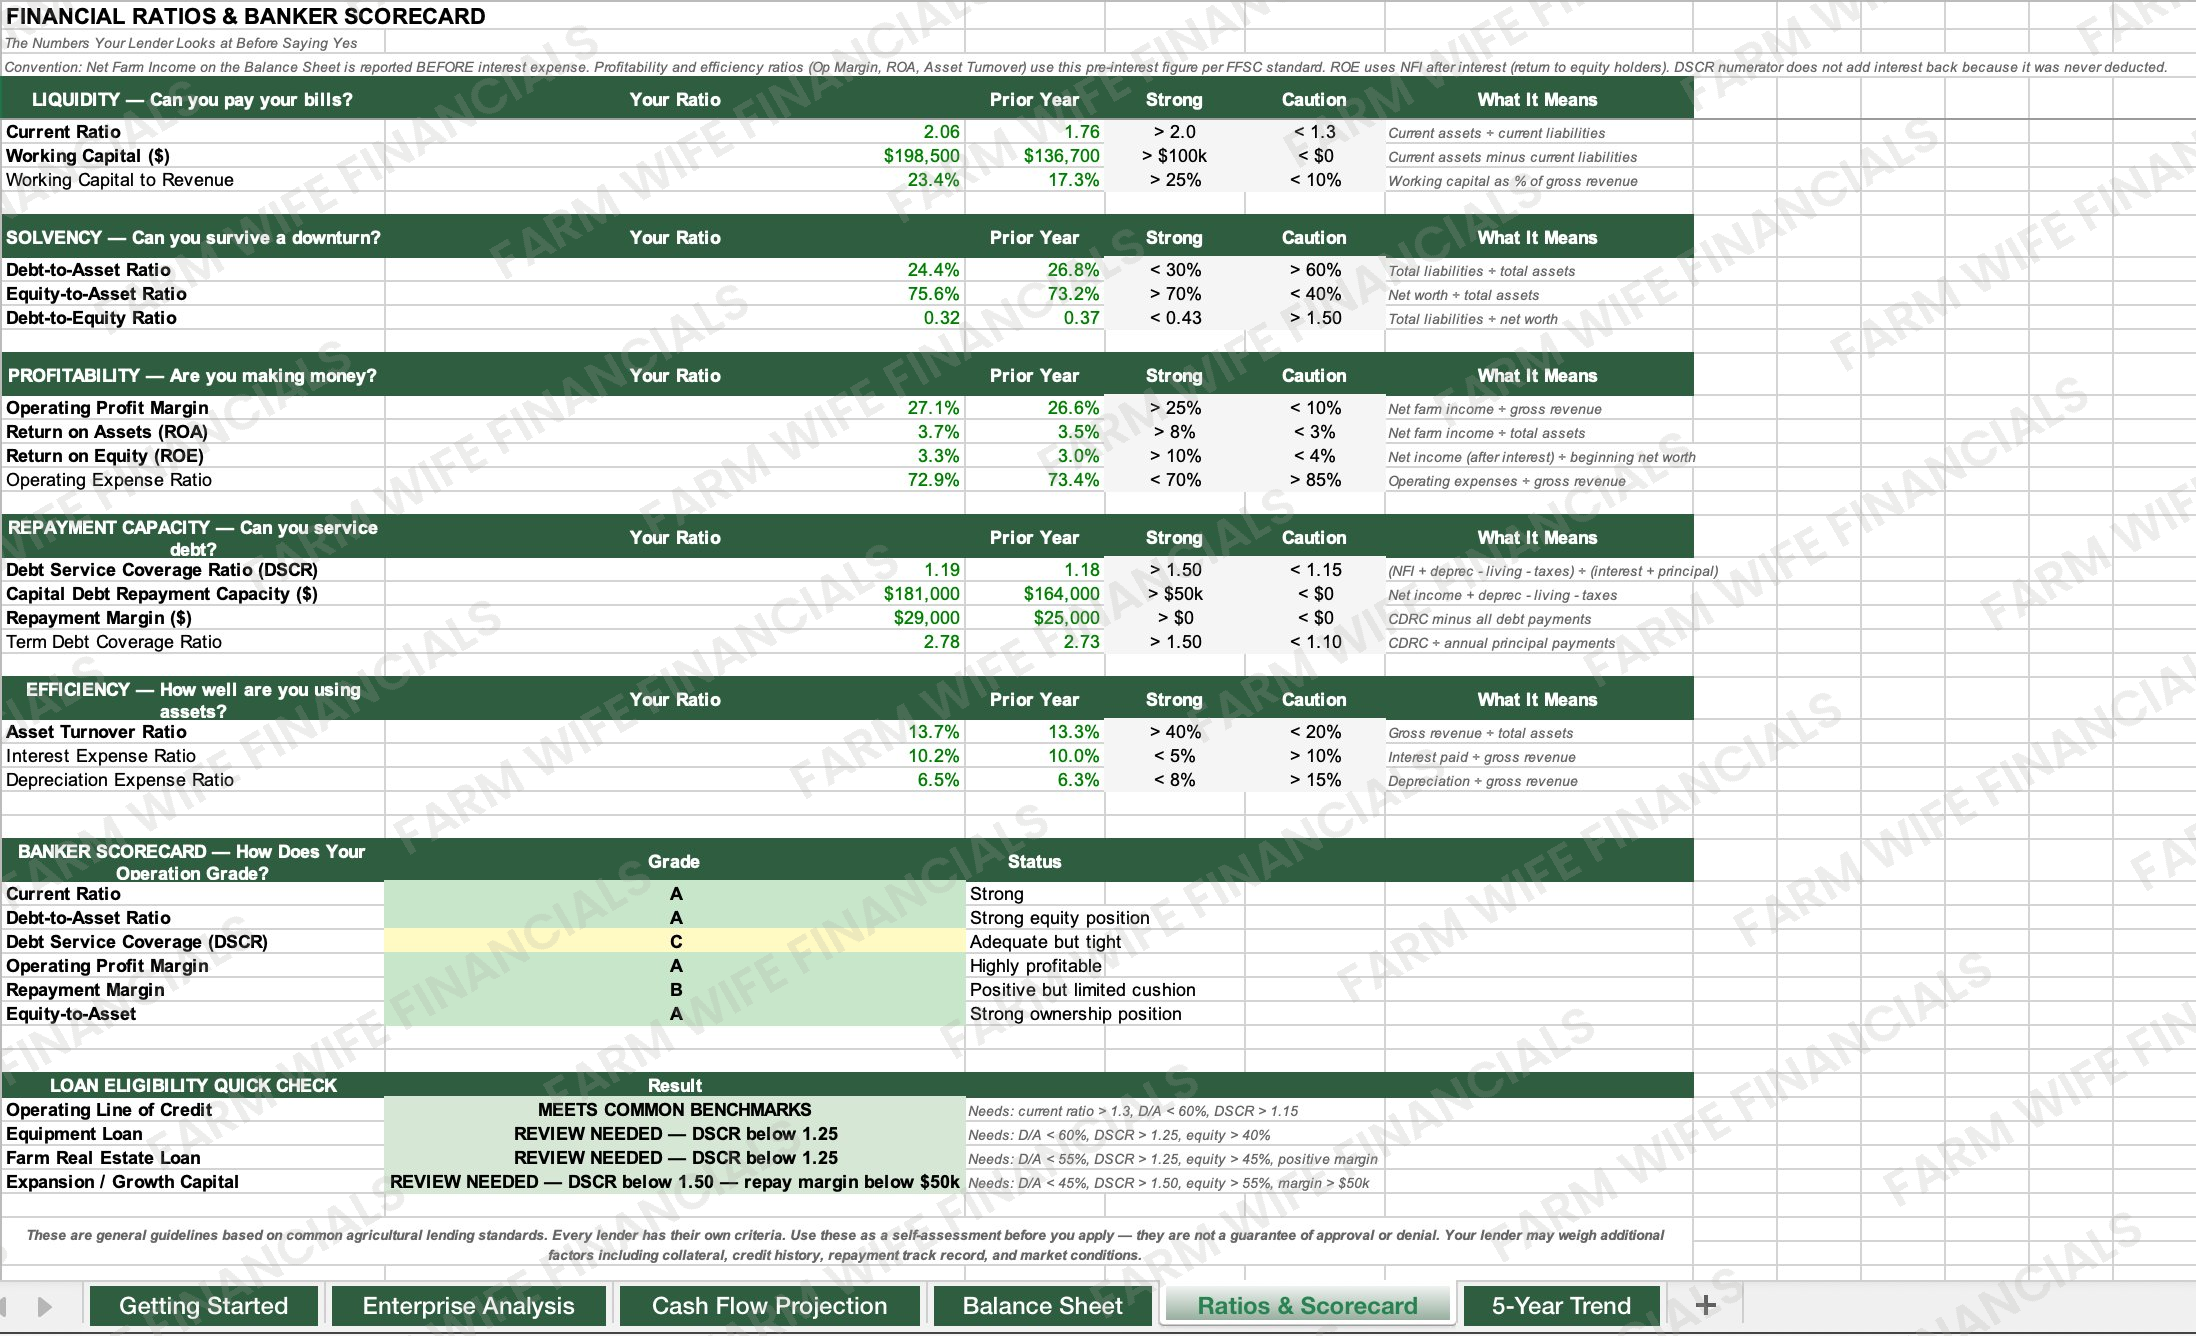
Ratios & Scorecard
16 financial ratios across 5 FFSC categories — liquidity, solvency, profitability, repayment capacity, and efficiency. Letter grades A-F that benchmark your ratios against common lender thresholds for operating line, equipment, real estate, and expansion.
5-Year Trend
Key financial metrics tracked over 5 years with trend arrows showing improvement or decline.
Looking for someone to manage your spreadsheets and keep your numbers up to date?
We offer an ongoing management service - we'll maintain your financial models, update your data, and keep everything organized and decision-ready so you can focus on running your operation.